


The main markets supplying feed & energy for Vietnam in July 2019 are still Argentina, America, Brazil and China ... In which, Argentina becomes the largest supply market for Vietnam with 152 million USD, an increase of 14.96% compared to the previous month and an increase of 186.66% compared to the same period last year, raising feed import turnover & consumption in the first 7 months of 2019 to over 853 million USD, accounting for 47% of the market share.
Next is the US market with import turnover in July 2019 reaching over 37 million USD, up 8.24% compared to June 2019 but down by 23.38% compared to July 2018. In general, in the first 7 months of 2019, Vietnam imported feed & energy from this market, reaching over 362 million USD, down 1.92% compared to the same period in 2018.
The third is Brazil with import turnover of more than 13 million USD, down 59.92% compared to June 2019 but increasing 96.74% compared to July 2018, bringing total import turnover in the first 7 months of the year. 2019 to more than 141 million, down 51.84% over the same period in 2018.
In general, in the first 7 months of 2019, Vietnam spent more than 2.2 billion USD of feed & energy imports, up by 0.32% compared to the same period in 2018. The markets with strong growth in this period are: Canada with 31.8 million, up 168.12% compared to the same period in 2018, Australia with 18.3 million, up 113.4% over the same period in 2018, Philippines with over 10 million USD, up 30.12% over the same period in 2018, finally Argentina with more than 853 million, up 21.94% over the same period.
Feed Import & Energy in the first 7 months of 2019 according to the market
Unit: thousand USD
ĐVT: nghìn USD
|
Thị trường |
T7/2019 |
+/- So với T7/2018 (%) |
7T/2019 |
+/- So với 7T/2018 (%) |
|
Tổng KN |
323.287.500 |
7,26 |
2.215.298.586 |
0,32 |
|
Argentina |
152.081.902 |
14,96 |
853.646.395 |
21,94 |
|
Ấn Độ |
14.979.644 |
35,19 |
112.973.744 |
-1,65 |
|
Anh |
80.743 |
-37,08 |
687.506 |
-5,69 |
|
Áo |
654.156 |
557,11 |
2.229.248 |
-46,65 |
|
Bỉ |
290.324 |
48,16 |
5.450.904 |
-72,74 |
|
Brazil |
13.751.355 |
-59,92 |
141.960.916 |
-51,84 |
|
UAE |
1.387.151 |
-58,94 |
15.114.873 |
-63,88 |
|
Canada |
5.282.679 |
8,38 |
31.863.280 |
168,12 |
|
Chile |
1.454.307 |
1,187,00 |
6.256.256 |
-37,07 |
|
Đài Loan (TQ) |
10.529.560 |
68,29 |
44.813.902 |
-16,48 |
|
Đức |
848.281 |
0,23 |
6.012.114 |
4,61 |
|
Hà Lan |
949.784 |
40,76 |
9.428.476 |
-19,14 |
|
Hàn Quốc |
4.505.732 |
1,54 |
29.604.856 |
2,32 |
|
Mỹ |
37.360.040 |
8,24 |
362.683.133 |
-1,92 |
|
Indonesia |
8.720.240 |
55,83 |
44.145.229 |
-19,26 |
|
Italia |
2.809.215 |
20,31 |
28.862.838 |
0,71 |
|
Malaysia |
3.498.380 |
113,13 |
17.593.938 |
-22,66 |
|
Mexico |
448.808 |
411,54 |
1.585.918 |
-40,39 |
|
Nhật Bản |
-100,00 |
1.333.637 |
-43,23 |
|
|
Australia |
1.407.551 |
-27,34 |
18.333.908 |
113,40 |
|
Pháp |
3.043.782 |
41,03 |
19.371.033 |
-4,97 |
|
Philippin |
1.849.593 |
54,90 |
10.719.561 |
30,12 |
|
Singapore |
1.453.821 |
5,59 |
9.992.924 |
7,63 |
|
Tây Ban Nha |
764.933 |
20,92 |
6.442.215 |
-11,68 |
|
Thái Lan |
10.302.392 |
-2,34 |
73.010.953 |
16,93 |
|
Trung Quốc |
15.685.758 |
-6,70 |
112.253.130 |
-16,11 |
Source: Vinanet calculated from preliminary data of GDC
Import of animal feed materials such as wheat, corn, soybean and animal and vegetable fats and oils in the first 7 months of 2019.
Import of animal feed materials in the first 7 months of 2019
|
Mặt hàng |
7T/2019 |
+/- So với 7T/2018 |
||
|
Lượng (nghìn tấn) |
Trị giá (nghìn USD) |
Lượng (%) |
Trị giá (%) |
|
|
Lúa mì |
1.469 |
409.580 |
-51,5 |
-43,4 |
|
Ngô |
5.340 |
1.110.097 |
-1,8 |
0,4 |
|
Đậu tương |
1.020 |
402.824 |
0.6 |
-9,4 |
|
Dầu mỡ động thực vật |
|
392.025 |
|
-6,2 |
Source: Vinanet calculated from preliminary data of GDC
Wheat: Estimated volume of wheat imports in July 2019 reached 217 thousand tons with a turnover of US $ 58 million, bringing the total volume and value of imports of this item in the first 7 months of 2019 to more than 1,469 million. tons, worth more than US $ 409 million, down 51.45% in volume and 43.3% in value over the same period in 2018.
The main wheat import market in the first 7 months of 2019 is Australia accounting for 38% market share; Canada accounts for 21%; Russia accounted for 12%, the US 7% and Brazil 6%.
Most wheat import markets fell sharply in both volume and value compared to the same period in 2018, Russia, America and Australia. In the first 7 months of 2019, Russian wheat imports decreased by 88.34% in volume and sharply decreased by 85.76% in value over the same period. Next is the United States, which reduced 26.6% in volume and 26.68% in value over the same period. Finally, Australia decreased by 29.2% in volume and 22.32% in value over the same period in 2018. Meanwhile, Canada increased by 23.1% in volume and 24.97% in value compared to same period 2018; Brazil increased by 10.98% in volume and 41.36% in value over the same period in 2018.
Soybeans: Estimated volume of imported soybeans in July 2019 reached 68 thousand tons with a value of more than US $ 28 million, bringing the volume and value of US $ 402 million, up 0.56% in volume but decreasing by 9.42 % of value compared to the same period in 2018.
Corn: Estimated volume of imported corn in July 2019 reached more than 763 thousand tons with a value of USD 153 million, raising the volume and value of corn imports in the first 7 months of 2019 to over 5.3 million tons, worth cost more than $ 1.1 billion, down 1.83% in volume but up 0.4% in value over the same period in 2018.
However, the import of corn in the first 7 months of 2019 from major markets increased sharply both in volume and value compared to the same period last year. Argentina and Brazil are the two main corn import markets, accounting for 63% and 34% of the market, respectively.
(According to vinanet.vn)
 Consumer behavior changing dramatically in Asia
 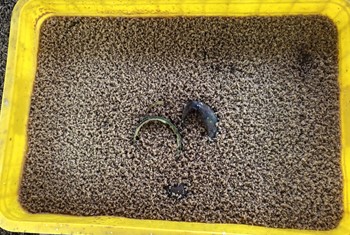 Raising this species of flies and then taking the eggs to sell for 3 million VND / 100 grams of fly eggs
  Poland: Poultry feed production hampered by Covid-19
  How to slow pig growth due to Covid-19?
  June feed update: What did you miss?
 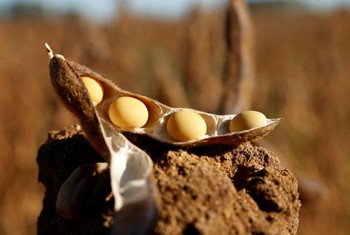 Good weather in the US slightly reduces soy price
 PTT Trading Service Co., Ltd
(Vietnam Address)
462, Pham Thai Buong Street,
(R3-37 My Toan 1 - H4), Phu My Hung,
Tan Phong Ward, District 7,
Ho Chi Minh City, Vietnam
Tel: (+84) 286 6868 5888
Singapore Office:
Blk 457, Pasir Ris Drive 4, #09-305
Singapore 510457
Contact: (+84) 903 077 931
Email: jeffreypang@pttgroup.org