


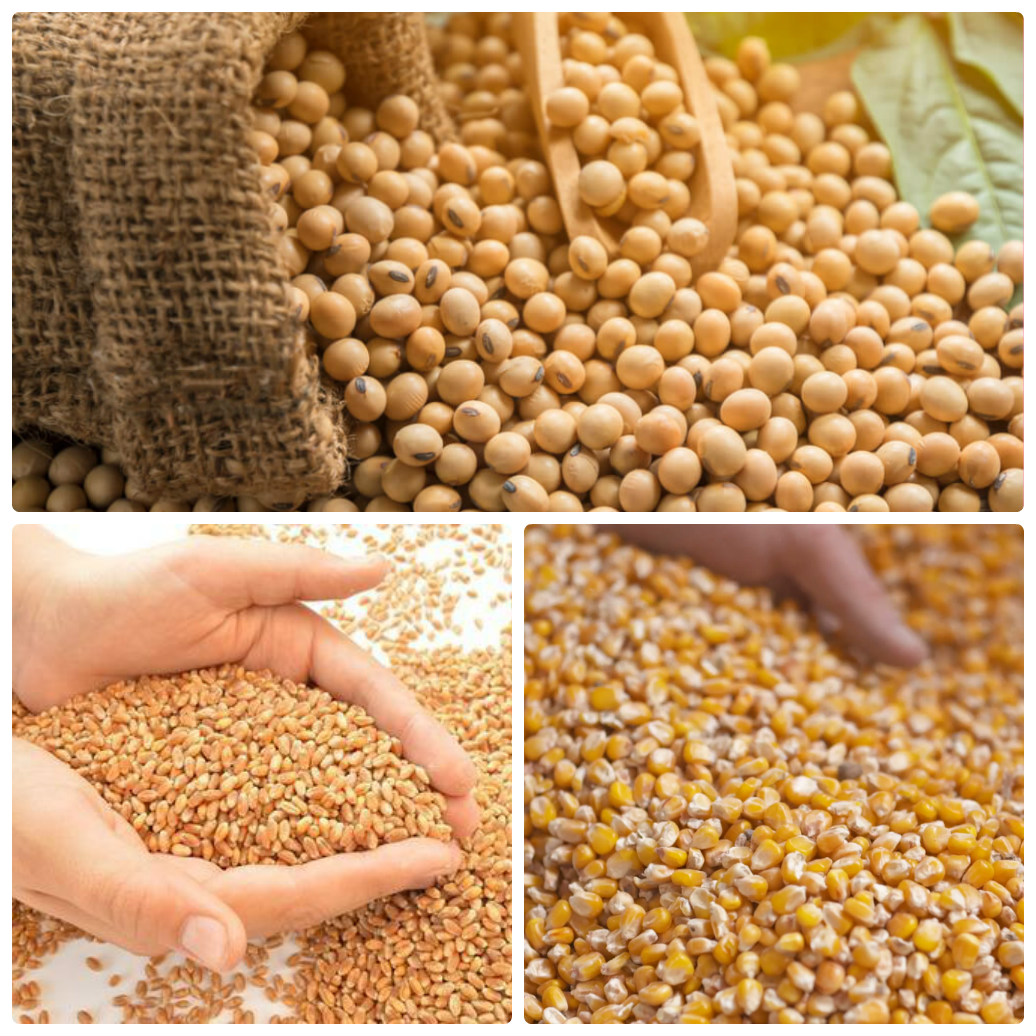
US FEED GRAINS and VEGETABLE AND ANIMAL PROTEIN
It is certainly nice to have some USDA reports being issued once again but the WASDE report out this week was not an exciting and earth-shattering report. Just a nice quiet report that seemed to confirm all the numbers that the trade had been expecting.
US Soybean yields were lowered a little which brought production down but there will still be millions of tons of soybeans looking for a home.
US corn yields were also decreased along with lower feed usage and a drop in use in ethanol.
US winter wheat plantings are lower, exports are steady and feed use is down a bit.
At the end of the week, after the WASDE, not much happened to prices --- for the week we had corn down by about USD 2 m/t with soybeans down by about USD 1, soymeal down by USD 5 m/t. wheat was down the most with hard red winter down by about USD 6 m/t and soft red winter wheat down by about USD 3 m/t, spring wheat was down by about USD 4 m/t.
It looks like the grain trade was not at all surprised by the USDA reports – so life goes on but now we have reports to tell us what we did know but weren't too sure about.
There was a report on GMO soybeans out this week looking at soybeans until 2026 and, according to the report, everything looks rosy for GMO soybeans, with growth of 14.3%. The reports states that "approximately 600 million m/t of GMO soybeans will be sold around the world by 2026".
Top Ten US Export Destinations for Grains and Oilseeds – 11 months 2018 – in m/t
|
Country
|
Wheat |
Corn |
Sorghum |
Soybeans |
|
Algeria |
308,600 |
|
|
|
|
Bangladesh |
|
|
|
1,079,400 |
|
Cameroon |
|
|
8,200 |
|
|
Canada |
|
1,785,300 |
53,600 |
|
|
China |
394,400 |
|
2,175,500 |
8,266,200 |
|
Colombia |
399,900 |
5,001,100 |
|
|
|
Costa Rica |
|
819,200 |
|
|
|
Djibouti |
|
|
38,700 |
|
|
Germany |
|
|
|
901,900 |
|
Guatemala |
|
1,017,500 |
|
|
|
Indonesia |
625,200 |
|
|
2,448,100 |
|
Japan |
2,606,400 |
14,256,000 |
386,800 |
2,043,500 |
|
Kenya |
|
|
38,200 |
|
|
Mexico |
2,581,800 |
15,331,200 |
167,800 |
4,144,500 |
|
Netherlands |
|
|
|
3,295,900 |
|
Nigeria |
732,200 |
|
|
|
|
Pakistan |
|
|
|
1,794,900 |
|
Peru |
|
2,890,500 |
|
|
|
Philippines |
2,432,700 |
|
|
|
|
Saudi Arabia |
|
1,652,500 |
|
|
|
Somalia |
|
|
53,800 |
|
|
South Africa |
|
|
33,700 |
|
|
South Korea |
1,296,000 |
6,931,000 |
|
|
|
Sudan |
|
|
181,500 |
|
|
Taiwan |
872,000 |
3,050,000 |
|
1,975,300 |
|
Thailand |
|
|
|
1,309,000 |
|
|
|
|
|
|
|
Rest of the World |
7,627,400 |
12,725,300 |
430,200 |
15,048,100 |
|
|
|
|
|
|
@USDA GATS February 2019
It seemed like a quiet week for corn byproducts this week with major Asian buyers closed down for Chinese New Year – of course, Chinese New Year doesn't just affect China but also any country in Asia with a significant Chinese population, and there are many.
There was not a great deal of change on corn byproduct prices this week although prices out a few weeks were certainly much more attractive than February prices – this has been the situation for quite a few weeks now.
None of the trade reports are calling for a rally in prices so we will probably just move along for a while at about the same price level – until the next market shaking news.
USA exports of corn by-products – 11 months 2018 – major destinations and selected countries – in m/t
|
Country |
Distillers Dried Grains DDGS Jan/Nov 2018 |
Corn Gluten Meal
Jan/Nov 2018 |
Corn Gluten Feed
Jan/Nov 2018 |
|
Australia |
|
5,800 |
|
|
Bangladesh |
140,400 |
6,700 |
|
|
Burma |
59,000 |
2,600 |
|
|
Cambodia |
48,000 |
|
900 |
|
Canada |
609,500 |
66,700 |
|
|
Chile |
|
140,900 |
|
|
China |
201,700 |
|
|
|
Colombia |
193,300 |
91,100 |
28,400 |
|
Costa Rica |
77,100 |
|
|
|
Denmark |
|
6,600 |
|
|
Ecuador |
31,500 |
4,700 |
|
|
Egypt |
193,300 |
134,100 |
|
|
El Salvador |
62,400 |
4,000 |
|
|
Guatemala |
57,000 |
9,000 |
|
|
Honduras |
53,500 |
8,100 |
|
|
Indonesia |
751,400 |
132,100 |
1,700 |
|
Ireland |
353,500 |
|
429,000 |
|
Israel |
249,000 |
800 |
228,600 |
|
Jamaica |
18,500 |
|
|
|
Japan |
435,200 |
14,400 |
|
|
Malaysia |
62,800 |
29,600 |
|
|
Mexico |
1,879,900 |
19,900 |
24,100 |
|
Morocco |
184,400 |
|
55,300 |
|
New Zealand |
247,400 |
|
50,400 |
|
Panama |
19,200 |
|
|
|
Peru |
29,500 |
8,100 |
|
|
Philippines |
185,100 |
1,600 |
300 |
|
Portugal |
37,600 |
|
46,100 |
|
Saudi Arabia |
5,500 |
500 |
|
|
South Korea |
1,069,300 |
|
900 |
|
Spain |
213,700 |
|
|
|
Sri Lanka |
15,400 |
|
|
|
Taiwan |
200,400 |
35,300 |
|
|
Thailand |
942,900 |
30,200 |
800 |
|
Tunisia |
42,900 |
|
|
|
Turkey |
887,100 |
|
67,900 |
|
UK |
277,000 |
1,500 |
100,300 |
|
Vietnam |
1,137,300 |
14,800 |
|
|
|
|
|
|
|
Total exports |
10,993,500 |
772,900 |
1,035,300 |
@USDA GATS February 2019
Container shipments, minimum 200 m/t
|
Australian MBM 45% protein Australian MBM 50% protein Australian Feathermeal, 80% protein Australian Poultry Meal, pet food |
USD 370/380 m/t CNF Asia USD 410/420 m/t CNF Asia USD 570/580 m/t CNF Asia USD 730/740 m/t CNF Asia |
|
USA Meat & Bone meal, 50% protein
USA Feathermeal, 80% protein USA Poultry Meal, feed grade USA Poultry Meal, pet food grade |
USD 420/440 m/t CNF Asia USD 410/420 to Indonesia USD 580/600 m/t CNF Asia USD 525/545 m/t CNF Asia USD 800/820 m/t CNF Asia |
According to the Jacobsen Report, prices for meat and bone meal into Indonesia have weakened a little – mainly due to continued low prices seen from US exporters – heavy US supplies of MBM are keeping a lid on prices.
The Australian trade says that they have done all that is needed for approval by the Indonesian government for the approval of OZ MBM shipments. All the needed documentation had been supplied and it is now just a waiting game until Indonesian authorities say that all is OK.
US domestic prices for meat and bone meal are steady but strong pet food demand has pushed up the domestic price for pet food grade poultry meal with some sellers said to be offering at least USD 200 m/t higher than the indication price above.
Everyone has been expecting higher prices for animal protein for a while now but good supply in most exporting countries is holding back any serious price rally.
USA exports of animal protein – 11 months 2018 – major destinations – in m/t
|
Destination |
Meat and bone meal – includes poultry and pork Jan/Nov 2018 |
Feather meal
Jan/Nov 2018 |
|
Burma |
4,100 |
|
|
Cambodia |
1,500 |
|
|
Canada |
50,600 |
14,800 |
|
Chile |
300 |
27,900 |
|
China |
45,600 |
29,800 |
|
Colombia |
1,000 |
100 |
|
Ecuador |
14,600 |
|
|
Germany |
|
|
|
Honduras |
8,200 |
|
|
Indonesia |
167,800 |
25,400 |
|
Jamaica |
1,200 |
|
|
Malaysia |
7,500 |
|
|
Mexico |
180,700 |
|
|
Peru |
5,300 |
800 |
|
Philippines |
20,700 |
700 |
|
Sri Lanka |
2,400 |
|
|
Thailand |
15,800 |
|
|
Vietnam |
48,700 |
3,200 |
|
|
|
|
|
Total exports |
578,200 |
102,700 |
@USDA GATS February 2019
 Consumer behavior changing dramatically in Asia
  Raising this species of flies and then taking the eggs to sell for 3 million VND / 100 grams of fly eggs
 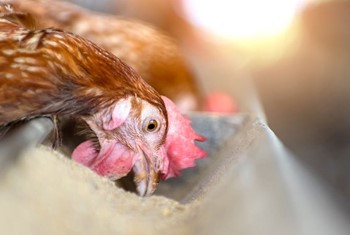 Poland: Poultry feed production hampered by Covid-19
 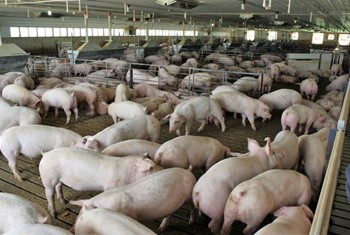 How to slow pig growth due to Covid-19?
  June feed update: What did you miss?
 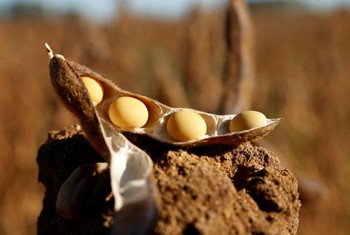 Good weather in the US slightly reduces soy price
 PTT Trading Service Co., Ltd
(Vietnam Address)
462, Pham Thai Buong Street,
(R3-37 My Toan 1 - H4), Phu My Hung,
Tan Phong Ward, District 7,
Ho Chi Minh City, Vietnam
Tel: (+84) 286 6868 5888
Singapore Office:
Blk 457, Pasir Ris Drive 4, #09-305
Singapore 510457
Contact: (+84) 903 077 931
Email: jeffreypang@pttgroup.org